Project 3 - Sales Analysis Using Pandas
Description
This is a project using pandas to analyse the sales productivity. By means of data analysis, we can answer the following questions:
What was the best month for sales? How much was earned that month?
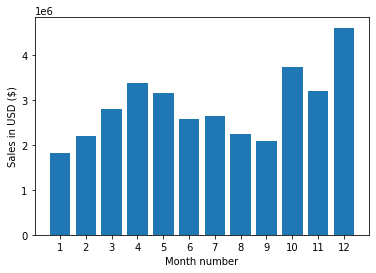
It makes sense that December is the best month of sales, becasue it is the period of Christmas and public holidays. People tend to buy presents for celebration.
What city sold the most product?
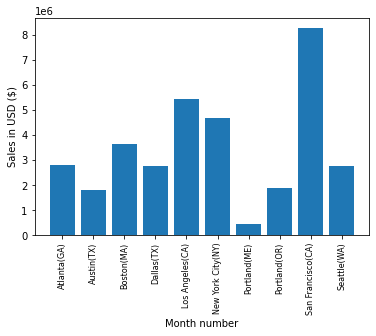
The reason for San Franciso to be the highest amont of product sales is that it is a electronic store that the dmeand for electronic is the highest in that region.
What time should we display advertisements to maximize likelihood of customer’s buying product?
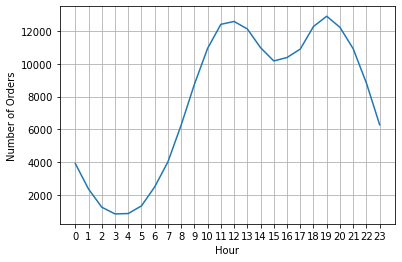
From the plot, the best time of advertisment is closely related to the peak hour of sale, The time can a bit earlier.
What products are most often sold together?
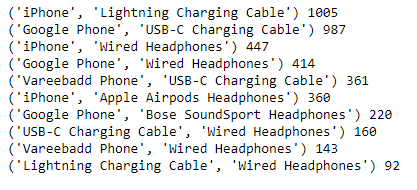
People tend to buy iphone with a lightning charging cable, there are total of 1005 counts wihtin a year of sale.
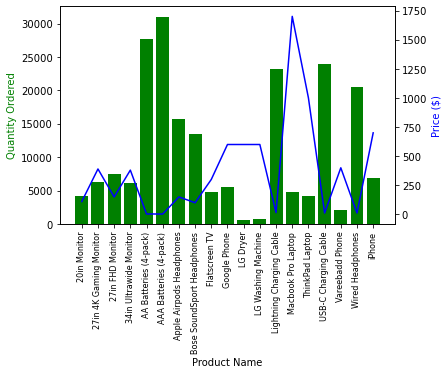
What product sold the most?
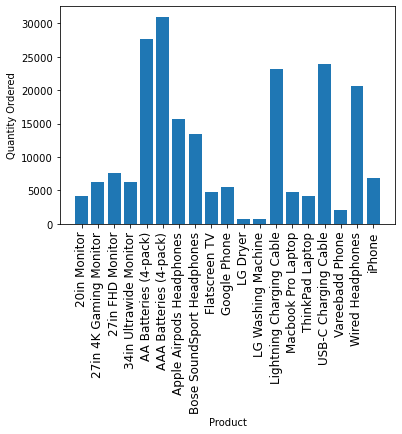
We find several items stand out from other products, like AA Batteries (4-pack), AAA Batteries (4-pack), Lightning Charging Cable, USB-C Charging Cable, Wired Headphones. These items are cheaper among all products, and they the accessories and neccessary.
Why do you think it sold the most?
By answering these questions, we can make a better decision on sales invesment, it can definitely help the firm to gain profit by visualizing the data.